Rama Kant Rai*
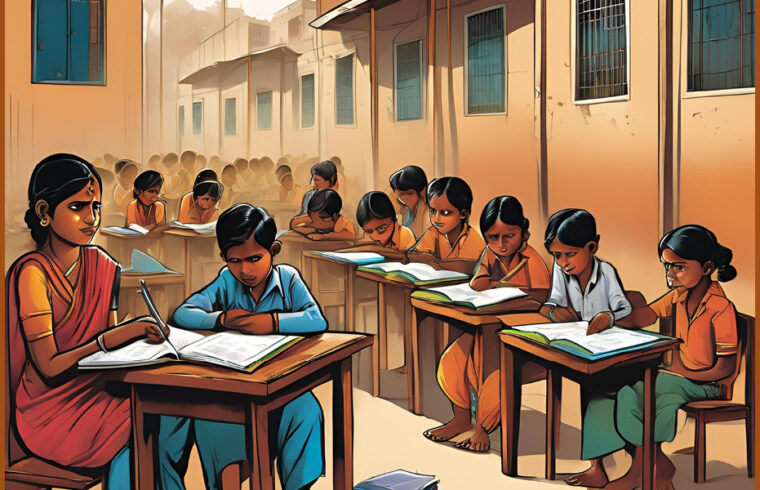
picture: Created with AI
- Introduction to Indian school education:
India is operating one of the largest school education system in world with more than 1509136 schools (>1.5 Million),(774742-Primary, 442928-Upper Primary, 151946-Secondary and 139520 Higher Secondary) nearly9.7 million, teachers(Pre-primary to higher secondary) and nearly 265 Million students of pre-primary to higher secondary level from varied socio-economic backgrounds.1
Education can be defined as the process of learning that continues throughout one’s life. It promotes mobilization of knowledge and contribute to one’s development. It helps people develop skills towards jobs and creates productive efficiency.2
However, the robust number of school education system of India faces various challenges of commitments to accomplish. These challenges are Sustainable Development Goal 4 (SDG.4) and Right of children to free and Compulsory Education Act 2009.
The SDG Agenda for Sustainable Development Goal 4 says; ‘Ensure inclusive and equitable quality education and promote lifelong learning opportunities for all’ (hereafter referred to as “Education 2030”) – and its associated targets, to be achieved by 2030.
Needless to reiterate that SDG 4 goals are beyond school education, rather they cover technical, tertiary, University Education and lifelong learning for all. Every effort must be made to guarantee that this time the goal and targets are achieved. This requires strong political will, clear strategies, indicators, programme and resources from state. Thus 7 years has elapsed and we have 8 years left to accomplish this herculean target by 2030.
- The Right of Children to Free and Compulsory Education Act 2009 (RtE Act 2009)
After a long struggle and advocacy by civil society organizations and leaders the Act or the RTE was enacted by the parliament of India on 3rd September 2009, The Act came into force on 1st April 2010 as a fundamental right in the form of Article 21A in the Indian Constitution which conferred a right to free and compulsory education for children of ages six to fourteen in 2002 which was hailed as a landmark move in the Indian education sector and the RTE act was finally passed in 2010.
The RTE act was finally passed in 2010 and it primarily had an input-based approach to education and essentially there was a lack of distinction between ‘schooling’ and ‘learning and having access to schools was equated to gaining knowledge. This input-based approach unfolded itself in the form of strict rules concerning infrastructure. On the curriculum and pedagogy front, syllabus completion, enrolment rates, retention rates, and teacher-pupil ratio were used as proxies for learning outcomes, and a ‘no detention policy’ was implemented. Although these inputs were easy to monitor, they harmed the education sector and children which it was supposed to ironically serve since this approach did not pay attention to the learning outcomes.
Although the enactment of RTE has been a promising move towards the right direction of enabling access to education for all, the progress so far seems to be ridden with obstacles since the ‘how’ of the act lacks in some of the significant aspects of education.
A huge amount of low-cost private schools that had sprung up in poor areas were rendered illegal and had to be shut down when RTE came into being as it allowed the government to close down private schools that did not meet stringent criteria in terms of infrastructure like having a playground or classrooms of fixed size and fixed teachers’ pay. It has been argued that this criterion of shutting down schools was unfair since learning outcomes were not used as a metric to assess the utility of school while metrics like not having a playground (that isn’t remotely related to learning outcomes) were considered a legitimate concern to shut down schools. Various evidence-based reports and empirical research have found that such input mandates do not correlate with learning outcome. This led to a decreased access to education for many children who would have otherwise studied in these low-cost private schools that their parents chose of their own accord.3
Special provisions were made to identify and keep annual record of children between ages 6 to 14 and provide them schools within 1 km radius for primary and 3 km for upper primary. Unfortunately these provisions did not get proper implementation to ensure identify every child and provide him/her schools.
Also the provisions for schooling below poverty line/EWS children by private schools quite often resulted in discrimination and neglect of poor children.
To further aggravate the situation, a no-detention policy under which a child cannot be detained or expelled from school till elementary education i.e. classes 1-8 is covered has been implemented under the RTE. This leads to students falling behind and not understanding anything despite attending school. It creates a problem of instructional mismatch where it becomes a demanding task for teachers in handling such variations and coming up with pedagogy to impart knowledge to all. This further disincentives them to engage with such pupils which ultimately leads to high dropout rates.
2.1 Progress of School education as shown in UDISE 2020-21
Chart (1)
Gross Enrolment Ratio (GER) by Gender and Level of School Education, 2020-21
Source: DISE booklet 2020-21
As shown in chart 1 the GER for girls outnumber boys during 2020-21 but progressing to Upper Primary it slips from 104.5 to 92.7 and in Secondary level it further decreases to 79.5 and gets aggravated to 54.6 . The situation is almost parallel to boys also which shows the GER in an appalling state.
Chart 2
2.2. Net Enrolment Rate by Gender in School Education in 2020-21
Source DISE 2020-21
Chart 2 shows the poor state of Net Enrolment rate for both boys and girls which dips almost three times from primary level to Higher secondary level during 2020-21.
2.3 Drop out Rate
Chart 3
Source DISE 2020-21
The Dropout rate is school education level is not very encouraging. It confirms the sudden dipping out of both boys and girls at Secondary to H Secondary level. This makes us a serious question as how the children will be able to completethe Higher Secondary Education to further enter in Higher Education or Technical education as enshrined in SDG.4.
2.4 Transition Rate by level of education and gender, 2020-21
Chart 4
Source DISE 2020-21
The transition from primary to upper primary looks encouraging but from Secondary to Higher Secondary it drips substantially for both boys and girls.
2.5. Retention Rate by level of education and gender, 2020-21
Chart 5
Source:Dise 2020-21
Retention rate gives a very discouraging picture. From Primary level to Upper Primary it decreases for both boys and girls and further in Secondary level. At Higher Secondary level it dips almost half of Primary level. This is very disheartening picture.
2.6 Implementation of New Education Policy 2020
The NEP 2020 has been put in practice for more than four years which recommends various directions for ambitious reforms and goals in education. The budget 2024-25 is fourth budget after the enactment of New Education Policy 2020. The NEP makes various recommendations in education sector which requires substantial budgetary allocations in phased manner. Beyond NEP the SDG 4 also required additional budget in education sector. In budget 2024-25 Education sector has been allotted 120.628 billion ( see chart 7 below) which is 0.37 per cent of the country’s GDP. After first year of implementation of NEP the allocation was 0.43 per cent whereas the need of allocation was 6 per cent of GDP. This has further gone to 0.37 per cent of GDP during 2024-25. This shows the dismal commitment of Govt for education sector and SDG 4.
2.7. Progress of school education as indicated by NITI AAYOG4
National Institution for Transforming India (NITI Aayog), the nodal body mandated to oversee the progress on the 2030 Agenda, has been monitoring the progress of SDG in India. NITI AYOG has prepared index of performance of SDG 4. To measure India’s performance towards the Goal of Quality Education, eleven national level indicators have been identified, which capture six out of the ten SDG targets for 2030 outlined under this Goal. These indicators have been selected based on the availability of data to ensure comparability across States and UTs.
The following table presents the composite scores of the States and UTs on this Goal. It also shows a breakdown of the States and UTs by indicator. Goal 4 Index Score SDG Index Score for Goal 4 ranges between 29 and 80 for States and between 49 and 79 for UTs. Kerala and Chandigarh are the top performers among the States and the UTs, respectively. Five States and three UTs bagged a position in the category of Front Runners (score range between 65 and 99, including both). However, nine States and two UTs fell behind in the Aspirants category (with Index scores less than 50).
Chart 6
- Infrastructure:
- Total (all management) 83.92% schools have electric connection; 82.15% Govt schools, 84.98 Private aided, 90.74 Pvt unaided and 72.63 other schools(unrecognized and Madrsa) haves functional electric connection.
- Only 32.54% Govt schools, 61.49% Pvt aided schools, 64.04% Pvt unaided schools and 32.17% other schools have computer facility for students.
- Only 13.64% Govt schools,43.81% pvt aided schools, 52.96% Pvt unaided schools and 22.66% other schools have internet facility
- 95.17% schools have functional drinking water facility.
- 93.31% Govt, 92.42% Pvt aided schools, 97.4 Pvt unaided schools and 85.2% private unrecognized and Madrasa have functional girls toilets.
- 89.48 % Govt schools, 86.26% pvt aided schools, 78.73% Pvt unaided schools and 52.02% Other schools have library facility.
- Only 55.99 % Govt schools, 63.29% Pvt aided schools, 34.91% pvt unaided schools and 20.13% other schools conducted medical checkup of students during 2020-21.
- Only 23.73 % Govt schools, 23.8% Pvt aided schools, 27.39% Pvt unaided schools and 14.64% other schools have CWSN friendly toilets in schools.5
(4) Teachers Availability:
Though according to DISE 2020-21 the number of teaching and non-teaching staffs has improved over the years from pre-primary to Higher Secondary level in absolute number. The number of teaching staff has increased to 9.69 million in the year 2020-21. This is an increase of 2.81% (.26 million) since 2018-19 but the UNESCO report 2019 gives a reverse picture. UNESCO launched its 2021 State of the Education Report (SOER) for India: “No Teacher, No Class” This report is based on based on Periodic Labour Force Survey (PLFS) and the Unified District Information System for Education (UDISE) data (2018-19).
As the report quotes a reference for enhancing the implementation of the National Education Policy (NEP) and towards the realization of the Sustainable Development Goal (SDG) 4 (target 4c on teachers).
Target 4c: By 2030, substantially increase the supply of qualified teachers, including through international cooperation for teacher training in developing countries, especially least developed countries and Small Island developing States.”
The position of vacancy of teachers in Uttar Pradesh in 3.3 Lakh, Bihar 2.2 Lakh, Bengal 1. Lakh is highly serious.
Out of total vacancies 69% is vacant in rural areas.
Madhya Pradesh has the highest number of single teacher schools with vacancies of 21 thousand teachers.6
Also 7.7% at Pre-Primary level, 4.6% in Primary level, 3.3% Upper Primary level and 0.8% at secondary level teachers are unqualified to teach.
4.1. Performance of States (Women Teachers): Tripura has the least number of women teachers, followed by Assam, Jharkhand and Rajasthan. Chandigarh leads the situation followed by Goa, Delhi, Kerala.
4.2. Increase in Number of Teachers in Private Sector: The proportion of teachers employed in the private sector grew from 21% in 2013-14 to 35% in 2018-19. The Right to Education Act stipulates that the Pupil-Teacher Ratio (PTR) should be 30:1 in classes 1-5 and 35:1 in higher grades.6
The shortage of teachers adversely affects the teaching in schools. Also a fairly significant number of teachers get engaged in nonteaching activities which makes it very difficult to maintain the rationalization of classes.
(5). Challenges of School Education Financing:
1. Inadequate Education Budget 2024-25:
The budget requirement to achieve SDG 4 was supposed to be in accordance with the targets and sub-targets for next 15 years. According to the report prepared by Technology and Action for Rural Advancement (TARA- An organization assigned to make assessment of resources for SDG by UNDP) The total funds needed for India to reach SDG-4 by 2030 is USD 2,258 billion, means from 2017 to 2030 averages USD 173 billion per year (12110 billion INR), whereas current govt budget of 1206.28 billion Rupees (2024-25) is too less.(See chart 7 below).
2. The MHRD’s budget is continuously declining. A similar trend is seen in terms of GDP. The total allocation to school and higher education in 2024-25 budget is Rs 1206.28 billion against last year budget of Rs 1297.18 Billion in 2023-24 (RE) Thus, there is a reduction of allocation in current budget. The Interim Union Budget 2024-25 is the fourth budget after the enactment of the NEP 2020, where the education sector has received Rs 1206.28 billion that is equivalent to 0.37 per cent of National GDP. During the first year of implementation of NEP 2020 this share was 0.43 per cent. (See Chart 8 below) While spending on education to the tune of 6 per cent of GDP is long awaited commitment this meager allocation shows the poor commitment on education.7
Source:1. (https://avpn.asia/wp-content/uploads/2017/09/Ecebook_forweb.pdf)
2. https://idronline.org/funding-education-with-impact/
5.1. Union Government’s Budgetary Spending on Education
Chart 8
5.2. Spending as % of Union budget and % of GDP
5.3. Digital/Online education budget:
As enumerated in the NEP 2020 it recognizes the advantages of technology in education and encourages the appropriate use of tools and platforms in this regard. The setting up of a ‚digital university‘ was announced in the Budget Speech, which will be built on the hub-and-spoke model and provide access to quality education to all students. However, this intervention doesn’t reflect in any budget documents or has any budgetary implications. With the goal of imparting supplementary education in regional languages, it was announced that the ‚one class, one TV channel‘ of the PM e-Vidya programme would be expanded from 12 to 200 TV channels. However, the budgetary allocation for PM e-Vidya has dropped from Rs 500 Million in 2021-22 (BE) to Rs 10000 for 2022-23 (BE).
Additionally, schemes such as Massive Open Online Course (MOOC) and Operation Digital Board(ODB )have no budgetary allocation this year and E-ShodhSindhu has been discontinued. As part of the strengthening of digital resources in rural areas, the Union Government announced that contracts for laying optical fibre in all villages would be awarded under the Bharat Net project through PPP in 2022-23, with an outlay of Rs19,041 .This initiative has still not reached in the rural areas.
(6). Out of school children and SDG 4:
The out of school children are a great challenge in implementing the RtE Act. Such children from unorganized sector, migrant labour families and victims of natural disaster etc are more vulnerable to become child labour. The Registrar General of India data shows that the proportion of out of school children is higher in rural areas and among SCs, STs and Muslims
The official numbers of out-of-school children in India are either out of date or contradictory. According to the 2011 Census, the number of out-of-school children in the 5-17 age group was 8.4 crore. However, according to a survey commissioned in 2014 by the Ministry of Human Resource Development, the number of out-of-school children in the 6-13 age group was only 60.64 lakh. This is a gross underestimation. It is quite unlikely that the number of out-of-school children came down so drastically from 2011 to 2014, especially given that there were no significant changes in objective conditions, warranting such a miraculous reduction.
6.1. A matter of serious concern
In a recent study conducted by Council for Social Development, New Delhi reveals the number of out-of-school children in India on the basis of the 71st round of the National Sample Survey (NSS) carried out in 2014. They took into account the 6-18 age group, which they consider to be the most appropriate for estimating out-of-school children, even though the Right of Children to Free and Compulsory Education (RTE) Act covers only the 6-14 age group. According to their estimate, out-of-school children in this age group were more than 4.5 crore in the country, which is 16.1% of the children in this age group. It is a matter of serious concern that nearly 15 years after the enactment of the RTE Act, and 16 years after the right to education was elevated to a fundamental right, such a large number of children are out of school.
(7) The SDG Agenda and Child labour:
A critical element of the 2030 Agenda is the commitment to “leave no one behind,” especially those in vulnerable situations. This includes children in difficult circumstance. By pledging to leave no one behind, States committed to ensure equality and reduce inequalities, including through eliminating discriminatory laws, policies and practices. The 2030 Agenda reaffirms States’ obligations regarding children’s rights by framing implementation in line with obligations to respect, protect and fulfill human rights. The application of human rights standards and principles, including the United Nations Convention on the Rights of the Child and its Optional Protocols, are also a crucial means through which the SDGs can be achieved. It’s a matter of serious concern that despite constitutional guarantees and international covenants a significant number of children from migrant labours are being deprived of education and schooling in India. Covid-19 led lock down made it more difficult to children of vulnerable migrant labours to realize the right to education in public schools. Census 2011 highlights the massive challenge in ensuring seasonally migrant children from around 10.7 million households in rural India to complete elementary education.
Unfortunately there is no exact number of migrant labour and their children out of school as the identification and documentation of such migrants are not done either in home state or host state of employment. It was a great deal of disastrous upheaval during Covid-19 outbreak when millions of unorganized labours were pushed to their village. On 14 September 2020, Labour and Employment Minister Santosh Kumar Gangwar stated in Parliament that information collected from state governments indicated an estimated 10 million migrants had attempted to return home as a result of the COVID-19 pandemic and consequent lockdown. He later stated in Parliament on 15 September 2020 that no data was maintained on the number of migrants in the country who had either died, or become unemployed, as a result of the pandemic, “while state wise data was “not available on assistance provided to migrant workers,”. India as a nation responded to the “unprecedented human crisis” through the various governments, local bodies, self-help groups and non-governmental organizations and professionals.
Unfortunately the identification of children, particularly the migrant and child labour is still not seriously enumerated as enshrined in RtE Act 2011. This makes difficult to migrant /child labour to get enrolled in schools and complete schooling.8
(8). Performance of quality in school education; National Achievement Survey 2021(NAS)
“The objective of NAS 2021 is to evaluate children’s progress and learning competencies as an indicator of the efficiency of the education system, so as to take appropriate steps for remedial actions at different levels.”
Key Findings-
– Poor Student Grades: Between 2017 and 2021, students‘ grades in subjects ranging from math to social sciences declined by up to 9 percentage points.
– Pandemic Stress: Almost 80% of students, felt that learning at home during a pandemic was “stressful” compared to learning at school. Out of all the students surveyed, 24% had no access to digital devices, and 38% said it was difficult to complete learning activities at home during a pandemic. Around 45% students found digital learning experience joyful
– Science Learning Challenges: Survey showed that, out of a total score of 500, students in different grades have more score in language, compared to math and science math and science. For example, third grade students achieved the best results in language (323), followed by EVS (307) and math (306).
– Backward classes faced struggle: Across various subjects and classes, SC, ST and OBC students performed worse than general category students. For instance, while general category students in Class 8 scored an average of 260 marks in mathematics, SC students scored 249 marks, ST scored 244 marks and OBCs scored 253 marks.
– Chandigarh performed the best among the UT’s
– Punjab and Rajasthan performed better than other states across all grades and subjects9
Adverse effect of Covid19 : Covid adversely affected the school performance during 2019-20. The following table shows the effect in NAS survey:
Key grade-wise findings detailed in the survey:
Class 3
In languages, the national average of scores obtained by students was 62 in 2021, compared to 68 in 2017. The corresponding math’s scores are 57 and 64, showing a drop of seven percentage points. The performance of states and UTs, when considered separately, show that many performed below the national average. For instance, the math’s score of Jharkhand and Delhi stand at 47 each.
Class 5
The national average score in maths is 44, compared to 53 in 2017, a fall of nine percentage points. The gap in national average language scores has widened by three percentage points, from 58 in 2017 to 55 in 2021. State-wise average scores show that in maths, Andhra Pradesh scored 40, Chhattisgarh 35 and Delhi 38. A state like Rajasthan, on the other hand, scored 53, as many as nine percentage points above the national average.
Class 8
The national average has come down from 42 to 36 in maths, 44 to 39 in science and social science, and 53 to 57 in language. In maths, Tamil Nadu and Chhattisgarh lagged behind the national average, with a score of 30 each. With a score of 50, Punjab, along with Rajasthan (46) and Haryana (42) scored much higher than the national average.
Class 10
While no comparative analysis could be done as the NAS round of 2017 did not include students of this grade, the 2021 numbers show the slide in performance deepens with every grade. The math score nationally is 32, according to the survey. The scores in science, social science, English and modern Indian languages are 35, 37, 43 and 41, respectively.
The report shows that Punjab was the best performer across grades and subjects. However the overall progress has dipped down from 2017 to 2021. Though the poor progress can also be attributed to Covid-19 lock down but the vacant position of teachers, deployment of teachers in non teaching work, non-preparedness for online education, lack of internet, smart phone for poor students can together be taken into account for this dip in score.
In February, the Centre had announced that states and UTs will have to plan “post-NAS interventions” based on the findings of the survey.10
LIST OF ABBREVIATIONS/TERMS
ASER – Annual Status of Education Report
A – Actual
B E – Budget Estimate
Crore – 10 Million
CWSN – Children with Special Need
EWS – Economically weaker Section
EVS – Environmental Studies
GER – Gross Enrollment Ratio
GDP – Gross Domestic Product
G O I – Government Of India
H.Sec – H. Secondary
MHRD – Ministry of Human Resource Development
MOOC – MassiveOpenOnlineCourse
NSSO – National Sample Survey Organization
NER – Net Enrollment Rate
NEP – National Education Policy
NITI AYOG – National Institution for Transforming India Ayog(Commission)
N A S – National Achievement Survey
O B C – Other Backward Communities
PTR – Pupil Teacher Ratio
PVT – Private
R E – Revised Estimate
RtE – Right o Children to Free and Compulsory Education Act
SDG – Sustainable Development Goal
S C – Scheduled Caste
S T – Scheduled Tribe
UT – Union Territories
UDISE – Unified District Information on School Education
1 Report on UNIFIED DISTRICT INFORMATION SYSTEM FOR EDUCATION PLUS (UDISE+)UDISE+2020_21_Booklet.pdf
2 The Evolution of Indian School Education, By https://digitallearning.eletsonline.com/author/digitallearningnetwork/ -April 8, 2019
3 Tiwari Vandana – Critique on Educational System in India – https://libertatem.in/blog/critique-on-educational-system-in-india/
4 SDG_3.0_Final_04.03.2021_Web_Spreads (1).pdf
5 UNIFIED DISTRICT INFORMATION SYSTEM FOR EDUCATION PLUS (UDISE+) 2020-21
6 DRISHTI 2021 State of the Education Report for India: UNESCO
7 CBGA OF MONIES AND MATTERS An Analysis of Interim Union Budget 2024-25 file:///C:/Users/HP/Desktop/Of-Monies-and-Matters-An-Analysis-of-Interim-Union-Budget-2024-25-2.pdf
8 Parliament question’s reply by Labour Minister Mr Santosh Gangwar on 14 September 2020.
9 National Achievement Survey 2021 Report, National Achievement Survey 2021 Report (jatinverma.org) 27 May, 2022
10 NAS 2021 Highlights, NAS 2021 Survey Updates, NAS 2021 Report: Across class, subject, Covid hits school scores – https://indianexpress.com/article/education/across-class-subject-covid-hits-school-scores-7936439/
*Rama Kant Rai is National Convener n National Coalition for Education, New Delhi and can be accessed at cosar.lk@gmail.com, phone +91 7011255324

